Why Patterns in Lottery Games Matter
People love to say the lottery is random and technically, it is. But only to a point. Complete randomness, in the real world, is messier than people think. Lotteries are designed to be fair, but when you look at enough draws over time, small behavioral patterns start to show up. Machines wear down. Humans run the show. Numbers repeat, sometimes more often than odds suggest, and not always without reason.
Historical draw data has shown subtle trends like certain numbers getting selected more often in specific games, or particular number combinations recurring in short bursts. This doesn’t mean there’s a master code to crack, but it does mean patterns exist. The question isn’t whether the lottery is rigged (it’s not). The better question is: what does long term data quietly reveal?
This is where serious players separate from casual dreamers. They track historical results. Look at frequency charts. Watch for clusters that recur. They know it’s still a gamble, but they also know which bets are less blind. Casual players, on the other hand, often stick to birthdays, random picks, or gut feelings ignoring the real metrics that can add an edge. One percent more informed is one percent less lucky guess.
Most Common Recurring Patterns
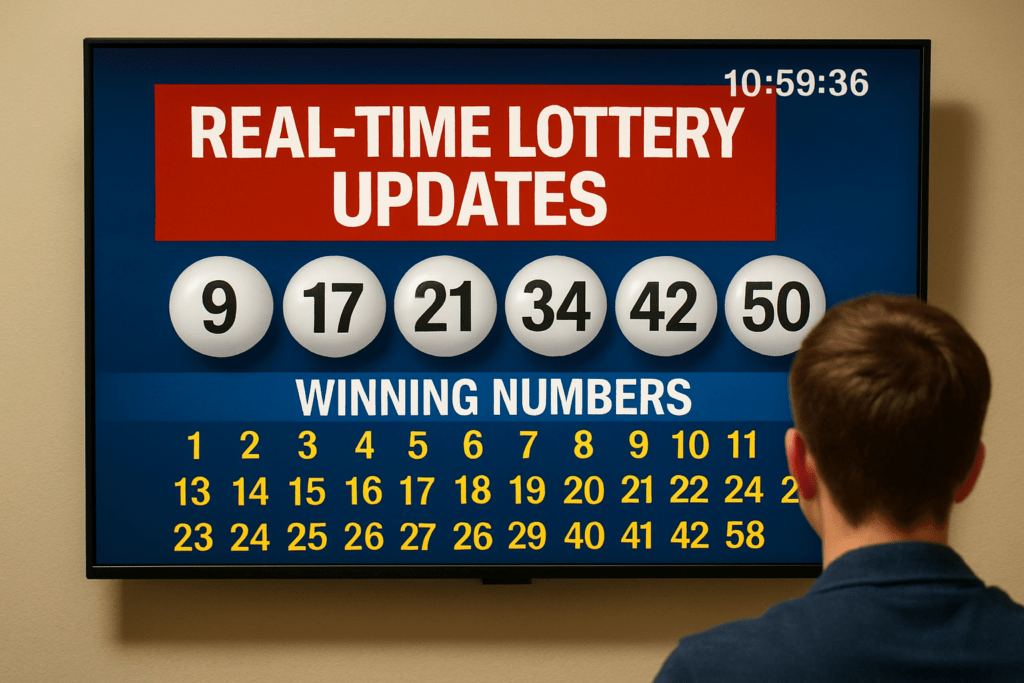
Hot and cold numbers are staples in the lottery world. Hot numbers are the ones that show up frequently over a certain period grab any 6 month draw history and you’ll see a few that just keep hitting. Cold numbers, on the other hand, barely make an appearance. Some players avoid them, some chase them, but either way, these numbers shift often typically every few draws to a few weeks, depending on the game and volume of entries.
Another trend? Repeating number clusters. These are groups of numbers that pop up together more often than you’d expect. They’re not magic, but they can suggest patterns in machine randomness or human influenced selection (like birthdays or favorite combos). While there’s no guarantee these clusters will show up again, smart players log them over time to spot possible reappearances.
Across different draw types whether it’s daily pick 3s or weekly 6/49s frequency patterns vary. Smaller games often produce tighter loops of repeating digits, while larger games spread selection wider, but still show some favor toward certain ranges or digit endings. The main takeaway: randomness doesn’t always look random when you zoom out. And tracking frequency gives players a sharper edge than relying on guesswork.
Drawing Format Influences
Not all lottery games are built the same and neither are their odds for patterns, repeats, or streaks. A 5/35 game (where five numbers are drawn from a field of 35) produces a very different statistical outcome than a 6/49 format. Smaller pools tend to see more number repeats and tighter clustering. Larger pools, like 6/49, create a wider spread with lower repeat frequency, simply because the combination possibilities explode.
But here’s the catch: people see patterns everywhere, even when the math keeps it random. For example, in a 6/49 draw, the chance of hitting a repeat number from the last draw is slim, but not zero. Over hundreds of draws, patterns like clusters (two or more numbers drawn close together) or groups (like all evens or all high numbers) can appear to form trends. Sometimes they’re meaningful in hindsight, but mostly, they’re just statistical noise.
So, are some formats more prone to hot streaks? Technically, no every combination has equal odds. But smaller pool games like 5/35 do have higher overlap potential between draws, which might make trends seem more visible.
Bottom line: structure matters. The size of the pool shapes how patterns emerge or don’t. But perception often runs ahead of probability. Recognizing the difference is what separates luck chasers from calculated players.
Seasonal Fluctuations in Outcomes

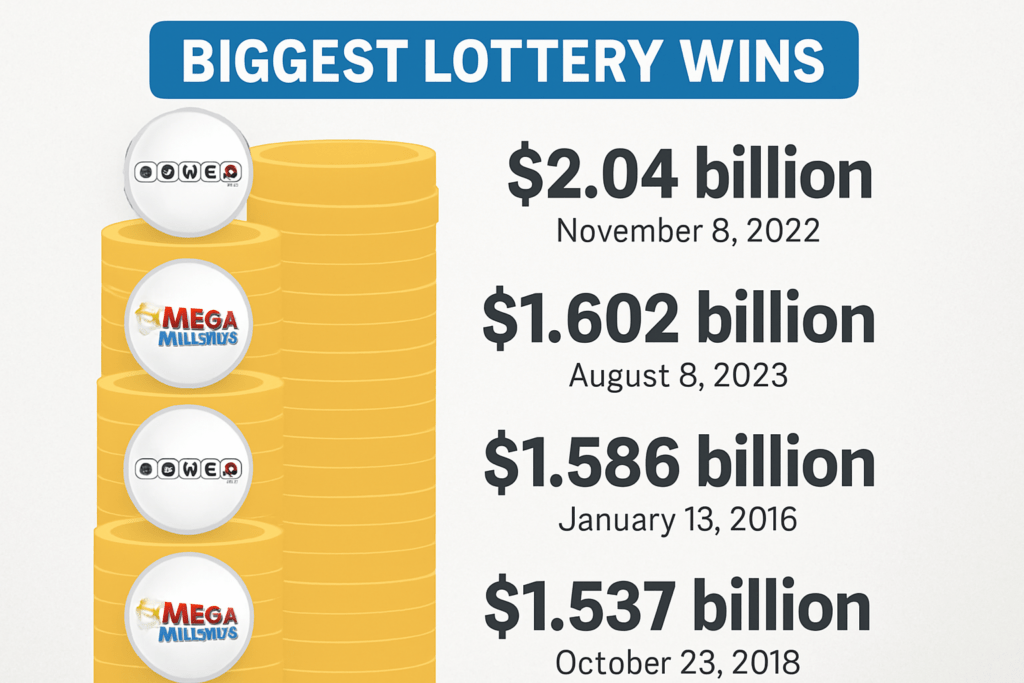
Lottery draws may be random in principle, but their results often show patterns that dip and rise with the calendar. During major holidays especially late December and early January ticket sales spike, often inflating jackpots. With more people playing, the chance of multiple winners goes up. But there’s more subtle stuff at play, too.
Tax season (in the U.S.) sees a minor bump in participation as people use refund money to chase big dreams. Summer tends to bring slower periods, except when a Powerball or Mega Millions jackpot snowballs into headline territory. Human behavior drives much of this. When people gather, when routines break (like during school breaks or long weekends), lottery participation shifts.
One concrete example: In the week leading up to last New Year’s Eve, the Mega Millions saw a 60% surge in ticket sales over its monthly average, leading to an unusual midweek draw with multiple million dollar winners. Trends like this don’t guarantee outcomes but for those looking closely, they do suggest when to expect upticks in unusual draw activity.
Explore more data backed shifts here: Seasonal lottery trends.
How Serious Players Use This Data
Serious lottery players know that while no strategy can guarantee a win, analyzing data can improve decision making and reduce guesswork. By leveraging patterns, frequencies, and draw histories, experienced players adopt a more calculated approach.
Tools of the Trade: Tracking Methods
Creating and managing a personal library of past draw data can be incredibly valuable. Players use a variety of tools:
Tracking software: Automated tools that log winning numbers, flag trends, and highlight number frequencies.
Spreadsheets: Customizable and hands on, ideal for organizing data sets, forming comparisons, and visualizing trends.
Manual recording: Traditional but effective for players who prefer deeper familiarity with each individual draw cycle.
Each method has its strengths, depending on how much time and effort a player wants to invest.
Smarter Strategies, Not Superstitions
Many casual players fall into the trap of luck based decision making. Serious players take a different route:
Avoid relying on “lucky” numbers with personal significance.
Don’t chase numbers that “feel due” without data to support it.
Use recurring patterns to inform not dictate choices.
The focal point is not prediction, but optimization.
Creating Balanced Tickets
A well structured ticket aims to cover a broader spectrum of possibilities. Key techniques include:
Number Ranges: Mix low and high numbers rather than clustering within one band.
Odds and Evens: Aim for a balance (e.g., 3 odd and 3 even in a 6 number draw).
Frequency Awareness: Include both commonly drawn (hot) and less frequent (cold) numbers based on data from previous draws.
Avoid Repetition: Rarely do the same combinations repeat. Mix formats and number sets regularly.
Balanced tickets may not increase odds dramatically, but they reduce predictability and cover more outcomes.
Adopting these practices doesn’t guarantee jackpot success but it does put logic over luck, and that’s a long term advantage in the world of numbers.
What To Avoid
Understanding lottery trends and patterns can be valuable, but it’s just as important to recognize the pitfalls that can derail a strategy. Many players fall into habits that feel intuitive but ultimately lead to unreliable decision making.
Don’t Overdepend on “Lucky Numbers”
Certain numbers often develop a reputation for being “lucky” birthdays, anniversaries, or numbers that have won in the past. While these may hold personal meaning, they do not have an increased statistical chance of appearing again.
Relying heavily on personal numbers restricts numerical variety
Many people choose the same popular numbers, increasing the chance of shared jackpots
Past wins don’t make a number more likely in future draws
Avoid Emotional Betting During Jackpot Fever
When jackpots climb to record highs, emotional decision making tends to replace strategy. The rush to participate can lead players to abandon smart practices in favor of impulsive choices.
Higher excitement doesn’t equal higher chances
Panic picking without structure leads to inefficient bets
Stay grounded in data, even when hype builds
Randomness Isn’t a Pattern
Perhaps the biggest trap in lottery play is mistaking randomness for reliable insight. Even when certain numbers appear more often for a time, this doesn’t mean a trend is forming.
Random patterns can appear meaningful, but still lack predictability
Coincidences are not strategies
True analysis focuses on frequency and structure not gut feelings
Key Takeaway
To become a more strategic player, avoid relying on misguided habits. Anchoring your play in observation and probability not emotion and superstition leads to smarter long term decisions.
Final Take on Trends and Patterns
Patterns aren’t predictions. They’re markers small signals in a noisy system. But for players who pay attention, they offer some direction. The key is not treating any one trend as a magic formula. Instead, combine several: frequency data, historical draws, seasonal context. Each adds another layer to your decision making.
It’s easy to cross the line from analysis into fantasy. That’s where judgment comes in. Serious players know not to chase ghosts in the data. They collect facts, note anomalies, and adjust their gameplay accordingly. Sharp doesn’t mean lucky it means alert, measured, informed.
Bottom line: tracking trends won’t hand you a jackpot. But it can help you play smarter. Lower the guesswork, reduce emotional picks, and maybe just maybe catch a repeat others missed.
(Deep dive: Seasonal lottery trends)


 George Dreyer brought valuable knowledge and creativity to the development of Jackpot Rush Empire, playing a key role in shaping the platform’s vision alongside its founder. With his keen eye for detail and dedication to quality, he helped ensure that the site delivers engaging lottery insights and meaningful content for its audience. His contributions were essential in building a platform that not only informs players about results and jackpots but also emphasizes responsible gaming and safe participation, aligning closely with the mission of Jackpot Rush Empire.